M104 R0–15 EPIC camera comparison
Previous mixed contract vs. traditional 3B masked full region · ObsID 0900170101
Executive conclusion
The traditional 3B full-region result confirms that pn0 still provides the strongest single-camera Fe-L statistics, but the degree of "PN dominating MOS" in the previous comparison was amplified by the shorter GTI and smaller BACKSCAL extraction area of the 4B MOS.
In 0.7–1.05 keV:
- Previous mixed contract(4B MOS + 3B pn0): MOS1+MOS2 net counts are 3,516, pn0 is 8,592, and the pn/MOS net-count ratio is 2.44;
- Traditional 3B masked full region(3B MOS1+MOS2+pn0): MOS1+MOS2 net counts increase to 5,534, pn0 remains 8,592, and the pn/MOS net-count ratio drops to 1.55;
- The MOS-only naive independent-counts S/N increases from 44.7 to 56.4; the naive S/N after adding pn0 increases from 85.5 to 92.2;
- The 3B MOS1/MOS2/pn0 Fe-L high/low values are 0.559 / 0.597 / 0.585, respectively. MOS1–PN0 and MOS2–PN0 differ by only −0.71σ and +0.37σ;
- pn0 is therefore still worth including in the controlled MOS+PN forward-folded validation fit, but neither the 1.63 nor the 1.91 counts-space S/N ratio is a kT precision forecast.
English summary. The all-3B comparison recovers substantially more MOS counts because the traditional MOS products have longer exposures and larger extraction footprints/BACKSCAL sky areas. PN0 remains the strongest single-camera Fe-L dataset, but its net-count advantage over MOS1+MOS2 decreases from 2.44 to 1.55. The response/area-normalized Fe-L colors remain statistically compatible. These are QPB-subtracted quick-look spectra, not fitted source-component significances; the counts-space gain is not a kT precision forecast.
Two data contracts
| Detector | Previous mixed | Exposure / PHA area | Traditional 3B | Exposure / PHA area |
|---|---|---|---|---|
| MOS1 | 4.background masked full-FOV alias |
65.76 ks / 120.3 arcmin² | 3B.background_20250124/...exclude_extent_source_mask |
78.81 ks / 162.6 arcmin² |
| MOS2 | 4.background masked full-FOV alias |
65.23 ks / 335.0 arcmin² | 3B.background_20250124/...exclude_extent_source_mask |
80.03 ks / 396.9 arcmin² |
| pn0 | 3B.background_20250124/...pn0...mask |
55.37 ks / 369.8 arcmin² | The same pn0 PHA/QPB/ARF/RMF | 55.37 ks / 369.8 arcmin² |
The PHA, QPB, ARF, and RMF SHA256 of PN0 are identical across the two contracts, so it is a strict control; the old-vs-new curve differences come only from the MOS products. The MOS and PN camera footprints are still not a pixel-identical common aperture.
Direct old–new comparison
0.4–3.2 keV ARF-unfolded surface brightness
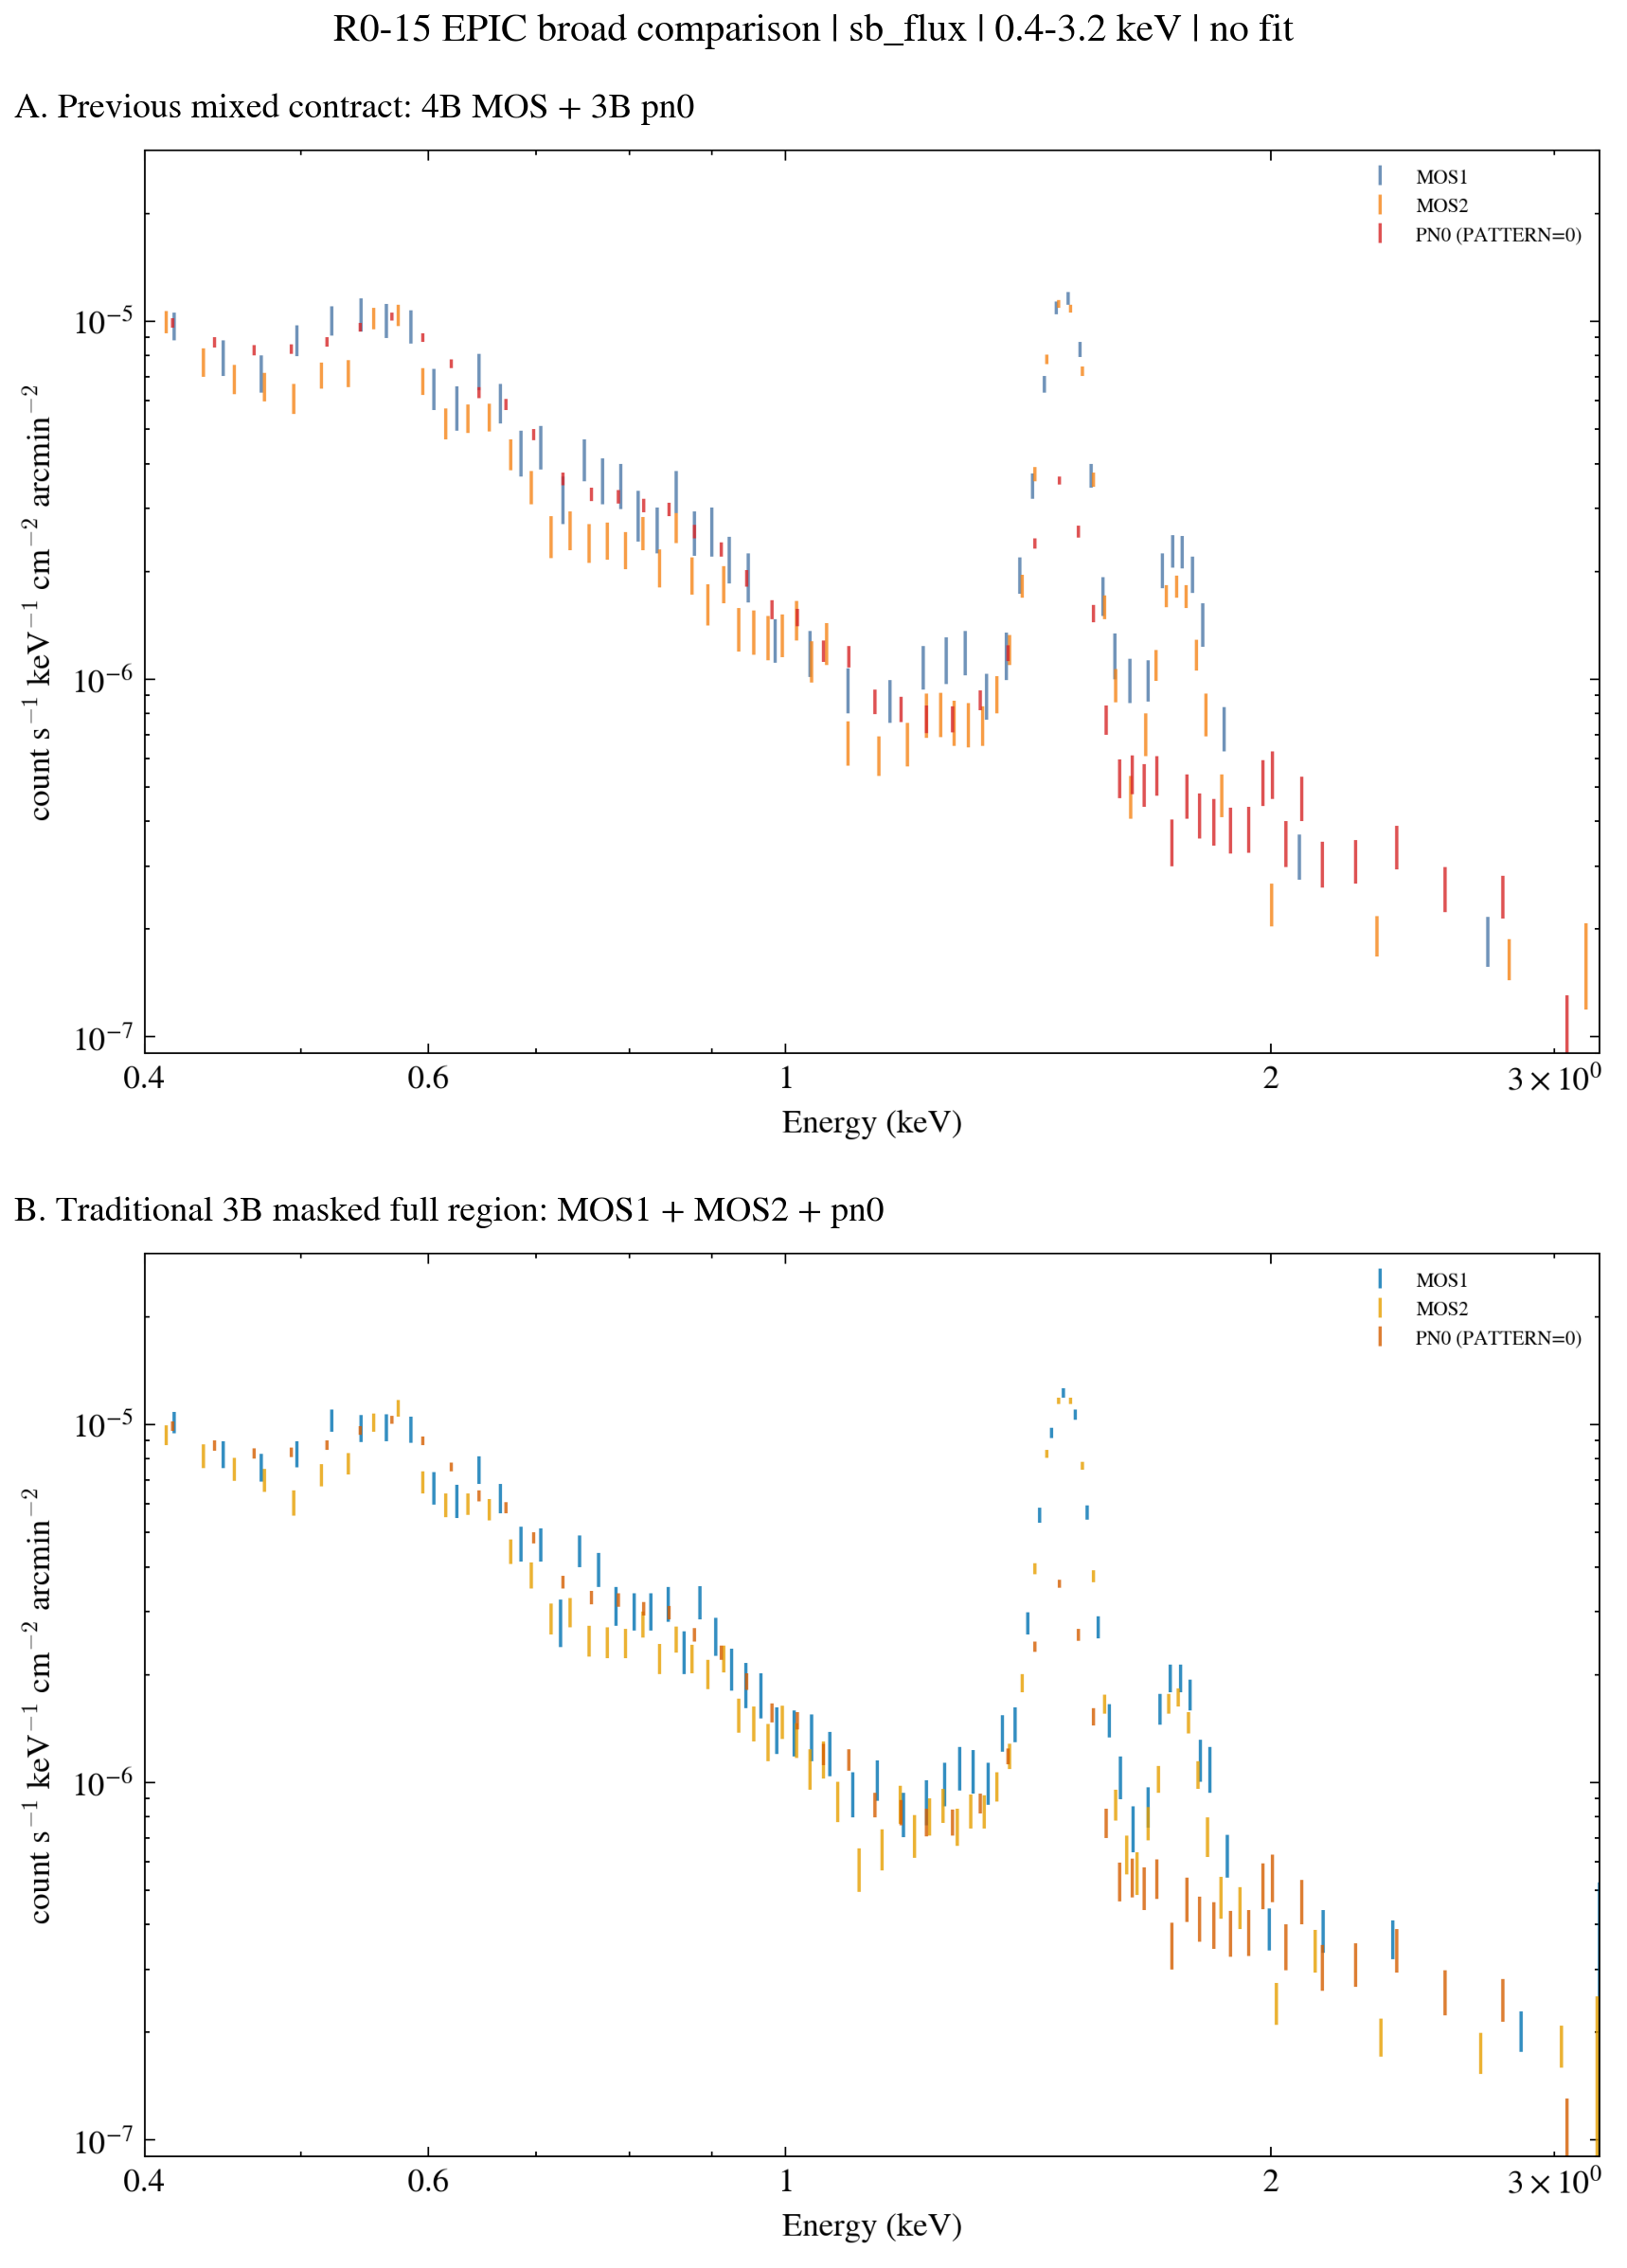
The two panels explicitly use the same x/y scales (sb_flux y-limit = 9×10⁻⁸–3×10⁻⁵). The overall shape is stable over 0.4–1.2 keV; the strong structures near 1.49 and 1.74 keV belong to the instrumental-line-sensitive region. In 2–3.2 keV the 3B MOS sb_flux can be higher by ~12–25%, which more likely reflects GTI, residual particle/SP, and response-weighting differences and cannot be directly interpreted as hotter source plasma.
0.6–1.2 keV Fe-L zoom
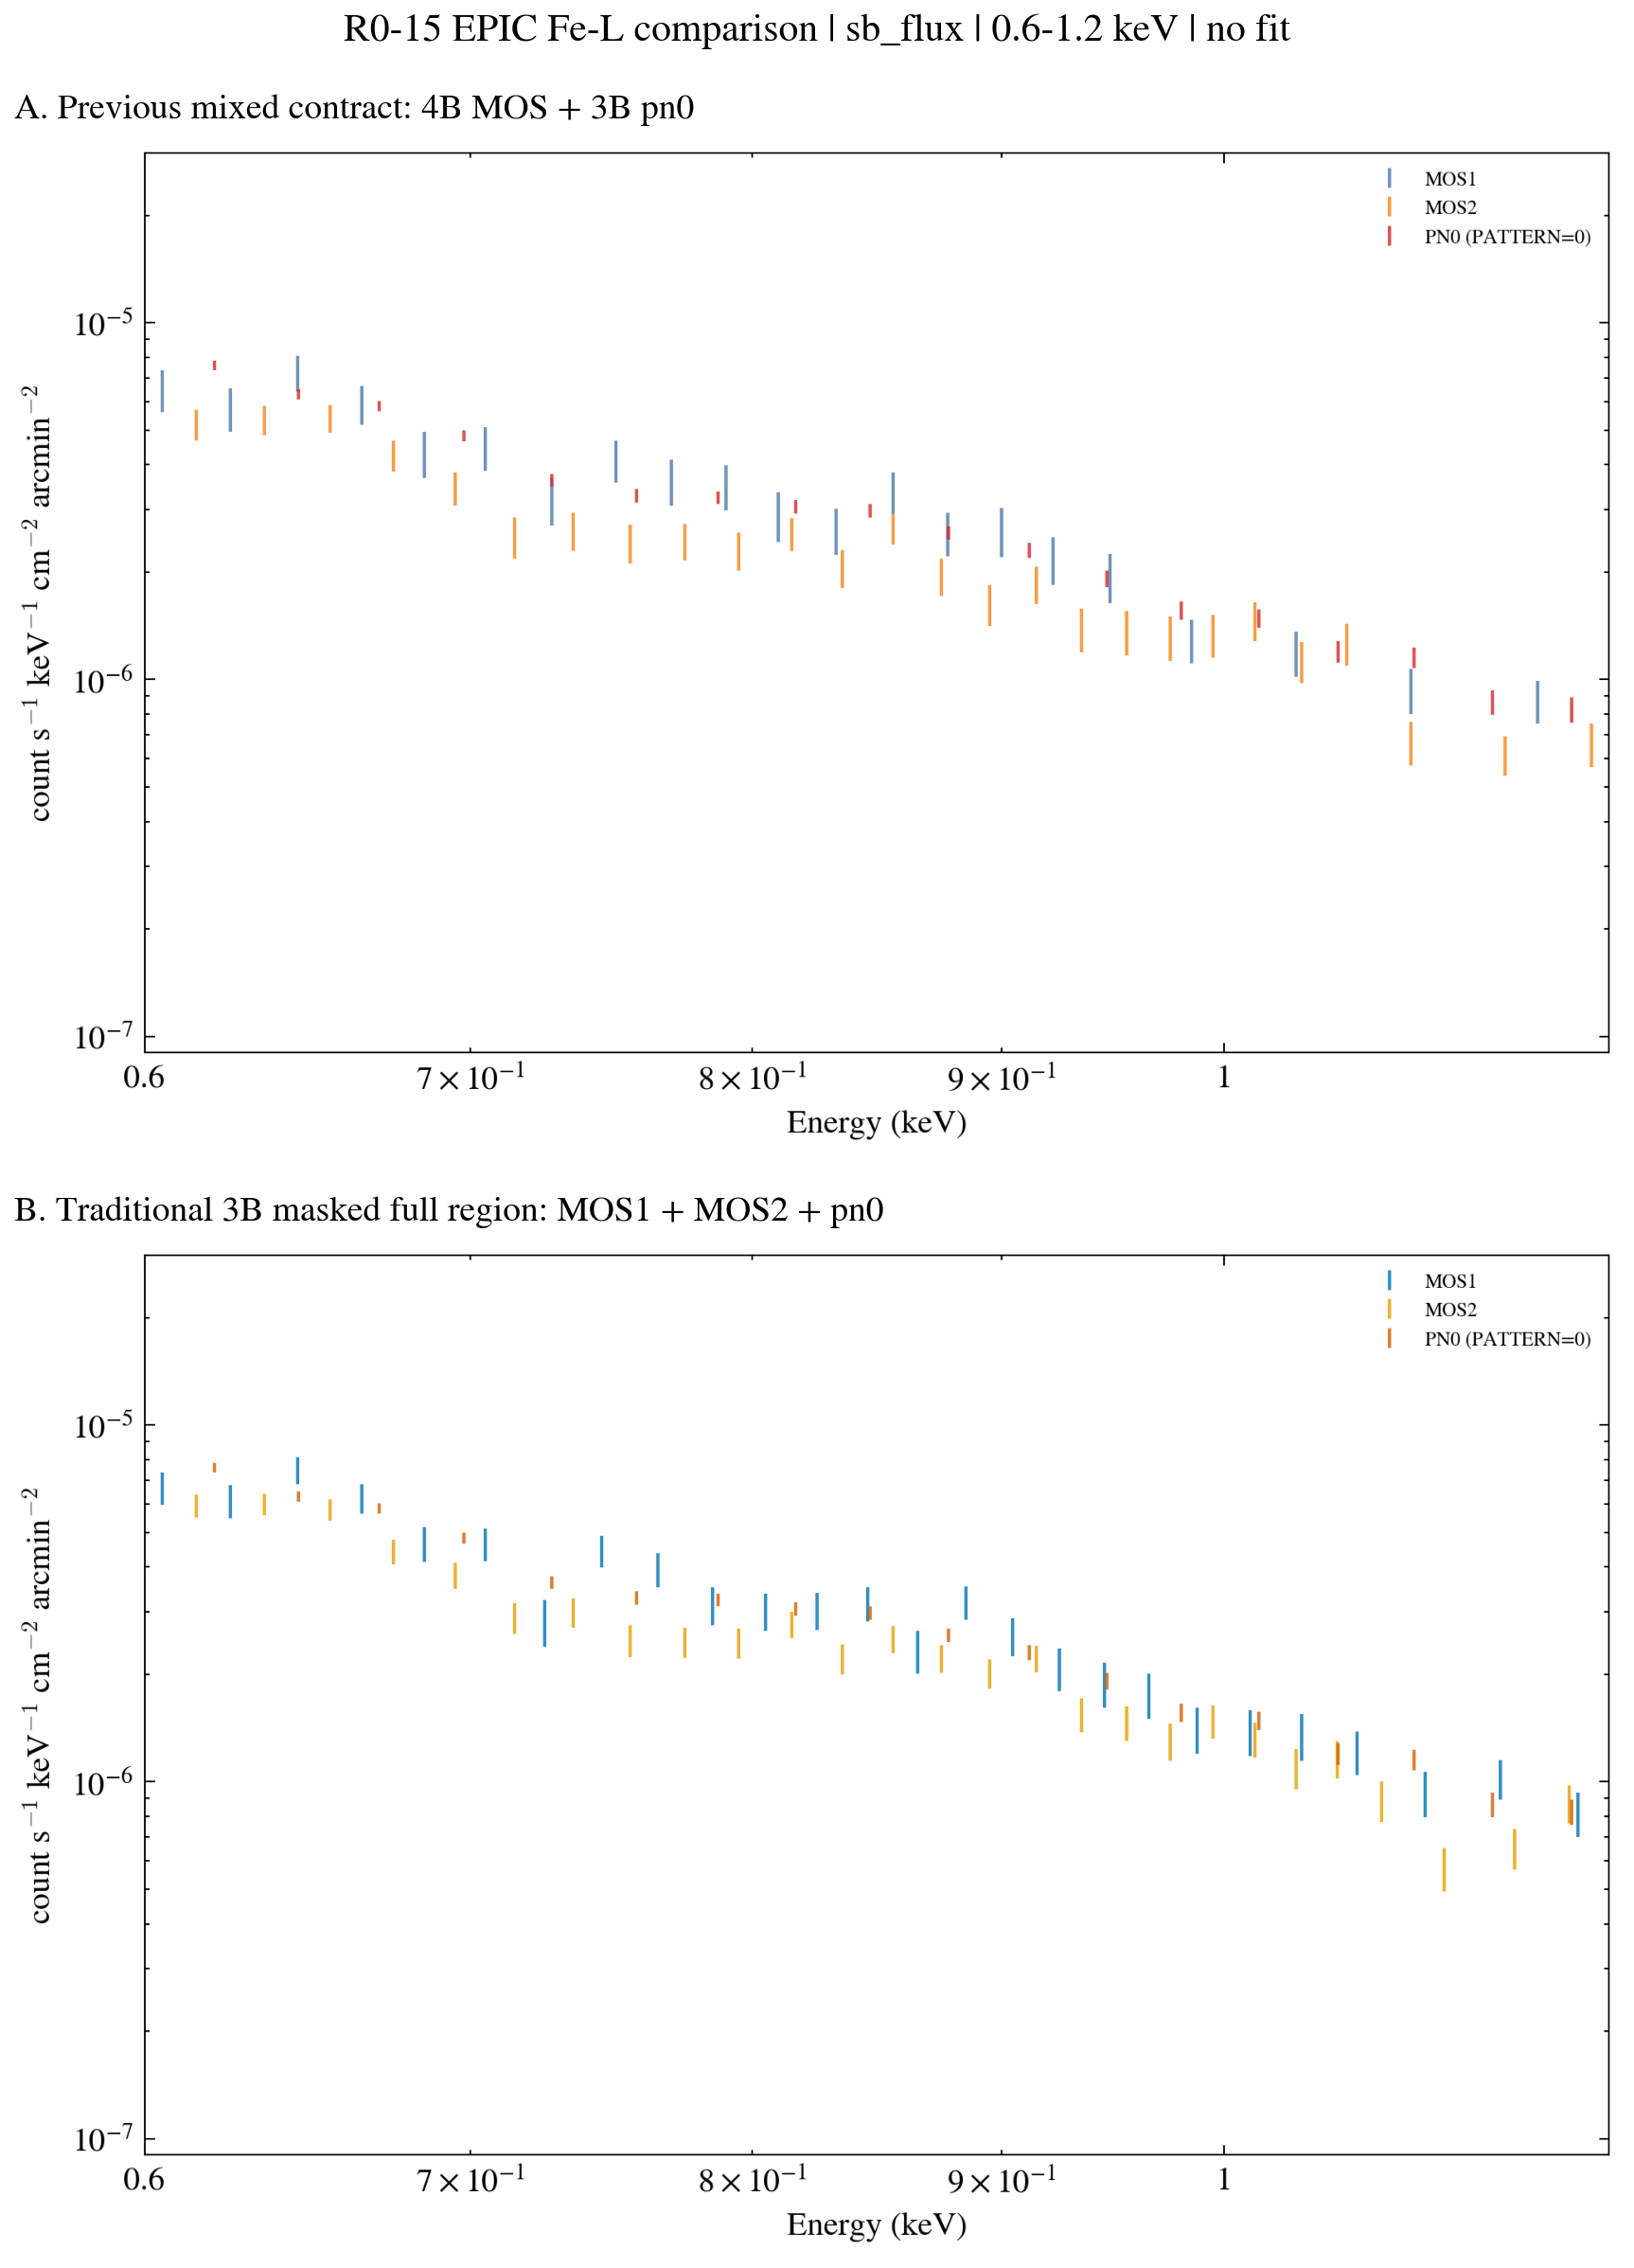
In the traditional 3B the MOS curves have smaller errors and more grouped bins; the Fe-L continuum slopes of the three instruments remain compatible. The figure has no model or fit and cannot distinguish M104, foreground, CXB, soft proton, and OoT components.
0.7–1.05 keV quantitative comparison
Previous mixed contract
| Detector | Source | Scaled QPB | Net | S/N | QPB fraction | Mean ARF |
|---|---|---|---|---|---|---|
| MOS1 | 1,750 | 582 | 1,168 | 27.5 | 33.3% | 172 cm² |
| MOS2 | 4,129 | 1,781 | 2,348 | 35.5 | 43.1% | 164 cm² |
| pn0 | 12,447 | 3,855 | 8,592 | 72.9 | 31.0% | 495 cm² |
Traditional 3B masked full region
| Detector | Source | Scaled QPB | Net | S/N | QPB fraction | Mean ARF |
|---|---|---|---|---|---|---|
| MOS1 | 2,987 | 1,029 | 1,958 | 35.2 | 34.4% | 173 cm² |
| MOS2 | 6,088 | 2,513 | 3,575 | 44.3 | 41.3% | 160 cm² |
| pn0 | 12,447 | 3,855 | 8,592 | 72.9 | 31.0% | 495 cm² |
MOS change of 3B relative to previous
| Detector | Exposure | PHA area | Net counts | S/N | Net rate per area | Approx. sb_flux |
|---|---|---|---|---|---|---|
| MOS1 | +19.8% | +35.2% | +67.7% | +28.0% | +3.5% | +2.9% |
| MOS2 | +22.7% | +18.5% | +52.3% | +24.9% | +4.8% | +7.1% |
| pn0 | 0.0% | 0.0% | 0.0% | 0.0% | 0.0% | 0.0% |
The conclusion is: most of the increase is counts and S/N brought by the MOS BACKSCAL extraction area × exposure, not an instrumental effective-area (ARF) or surface-brightness rise. The Fe-L mean ARF changes by only +0.6%/−2.2%, and sb_flux by only ~3–7%.
Fe-L color consistency
Physical half-open bands: low [0.700,0.875) keV, high [0.875,1.050) keV. Statistics use the RMF-channel midpoint lo <= E_mid < hi to avoid double-counting the nonlinear pn EBOUNDS boundary channel.
The errors and z-scores in the table below are count/QPB-statistical only: they propagate only source Poisson and QPB STAT_ERR, assume the two bands are independent, and exclude ARF/RMF calibration, soft-proton, sky/OoT, and common systematic errors.
| Contract | MOS1 high/low | MOS2 high/low | pn0 high/low | MOS1–PN0 | MOS2–PN0 |
|---|---|---|---|---|---|
| Previous mixed | 0.517 ± 0.039 | 0.589 ± 0.033 | 0.585 ± 0.017 | −1.61σ | +0.11σ |
| Traditional 3B | 0.559 ± 0.032 | 0.597 ± 0.027 | 0.585 ± 0.017 | −0.71σ | +0.37σ |
After 3B processing the MOS1–pn0 difference shrinks; MOS2 agrees with pn0 in both contracts. This change is consistent with sensitivity to the compound processing/footprint contract, but since PHA, QPB, ARF, and RMF all change at once, the specific cause cannot be isolated, and this does not constitute a precision cross-calibration measurement.
Traditional 3B-only inspect
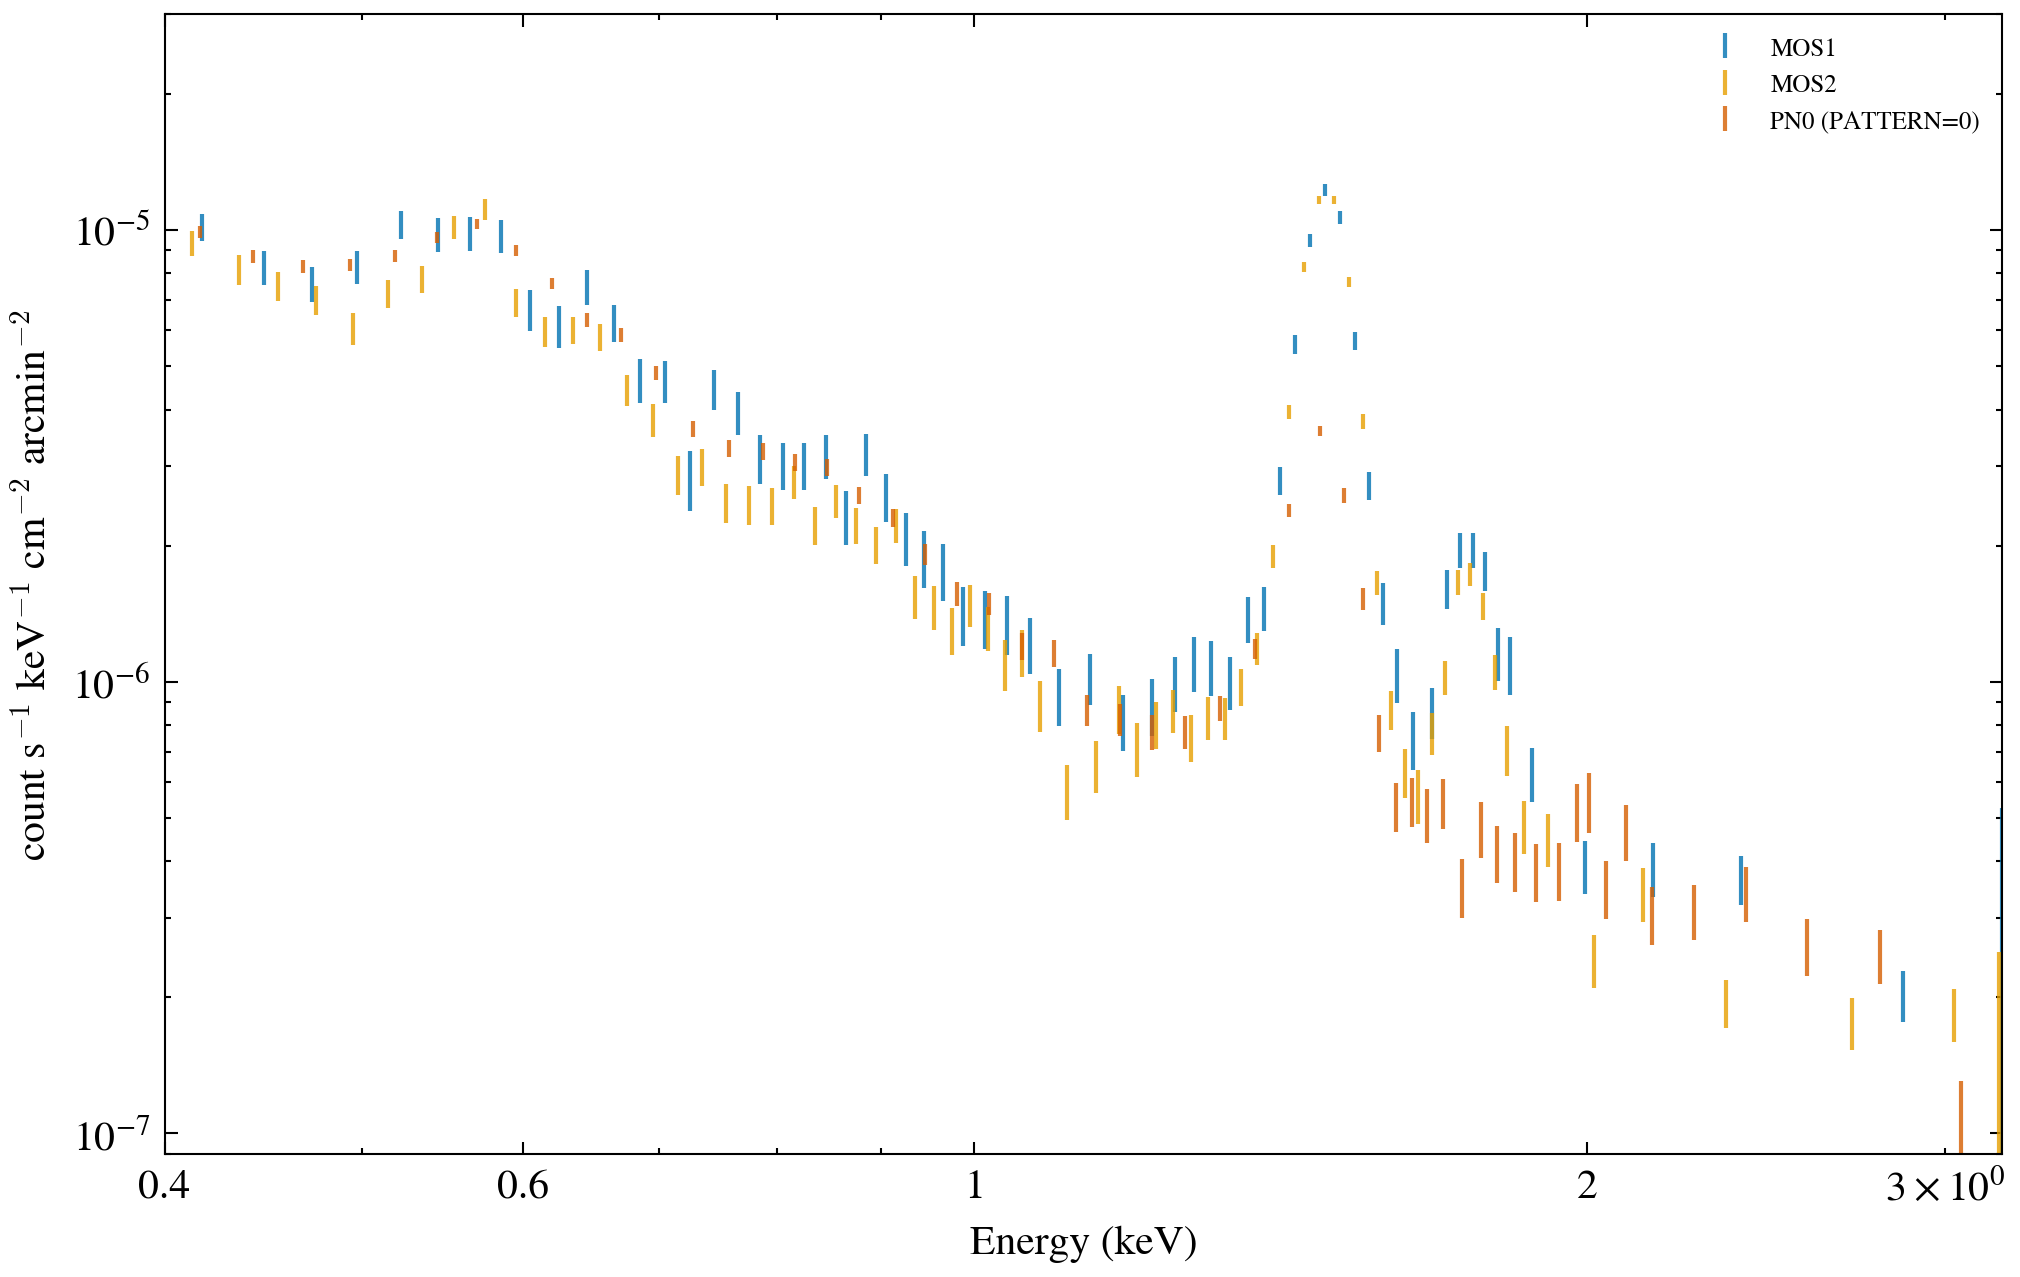
Broad sb_flux
Fe-L zoom sb_flux
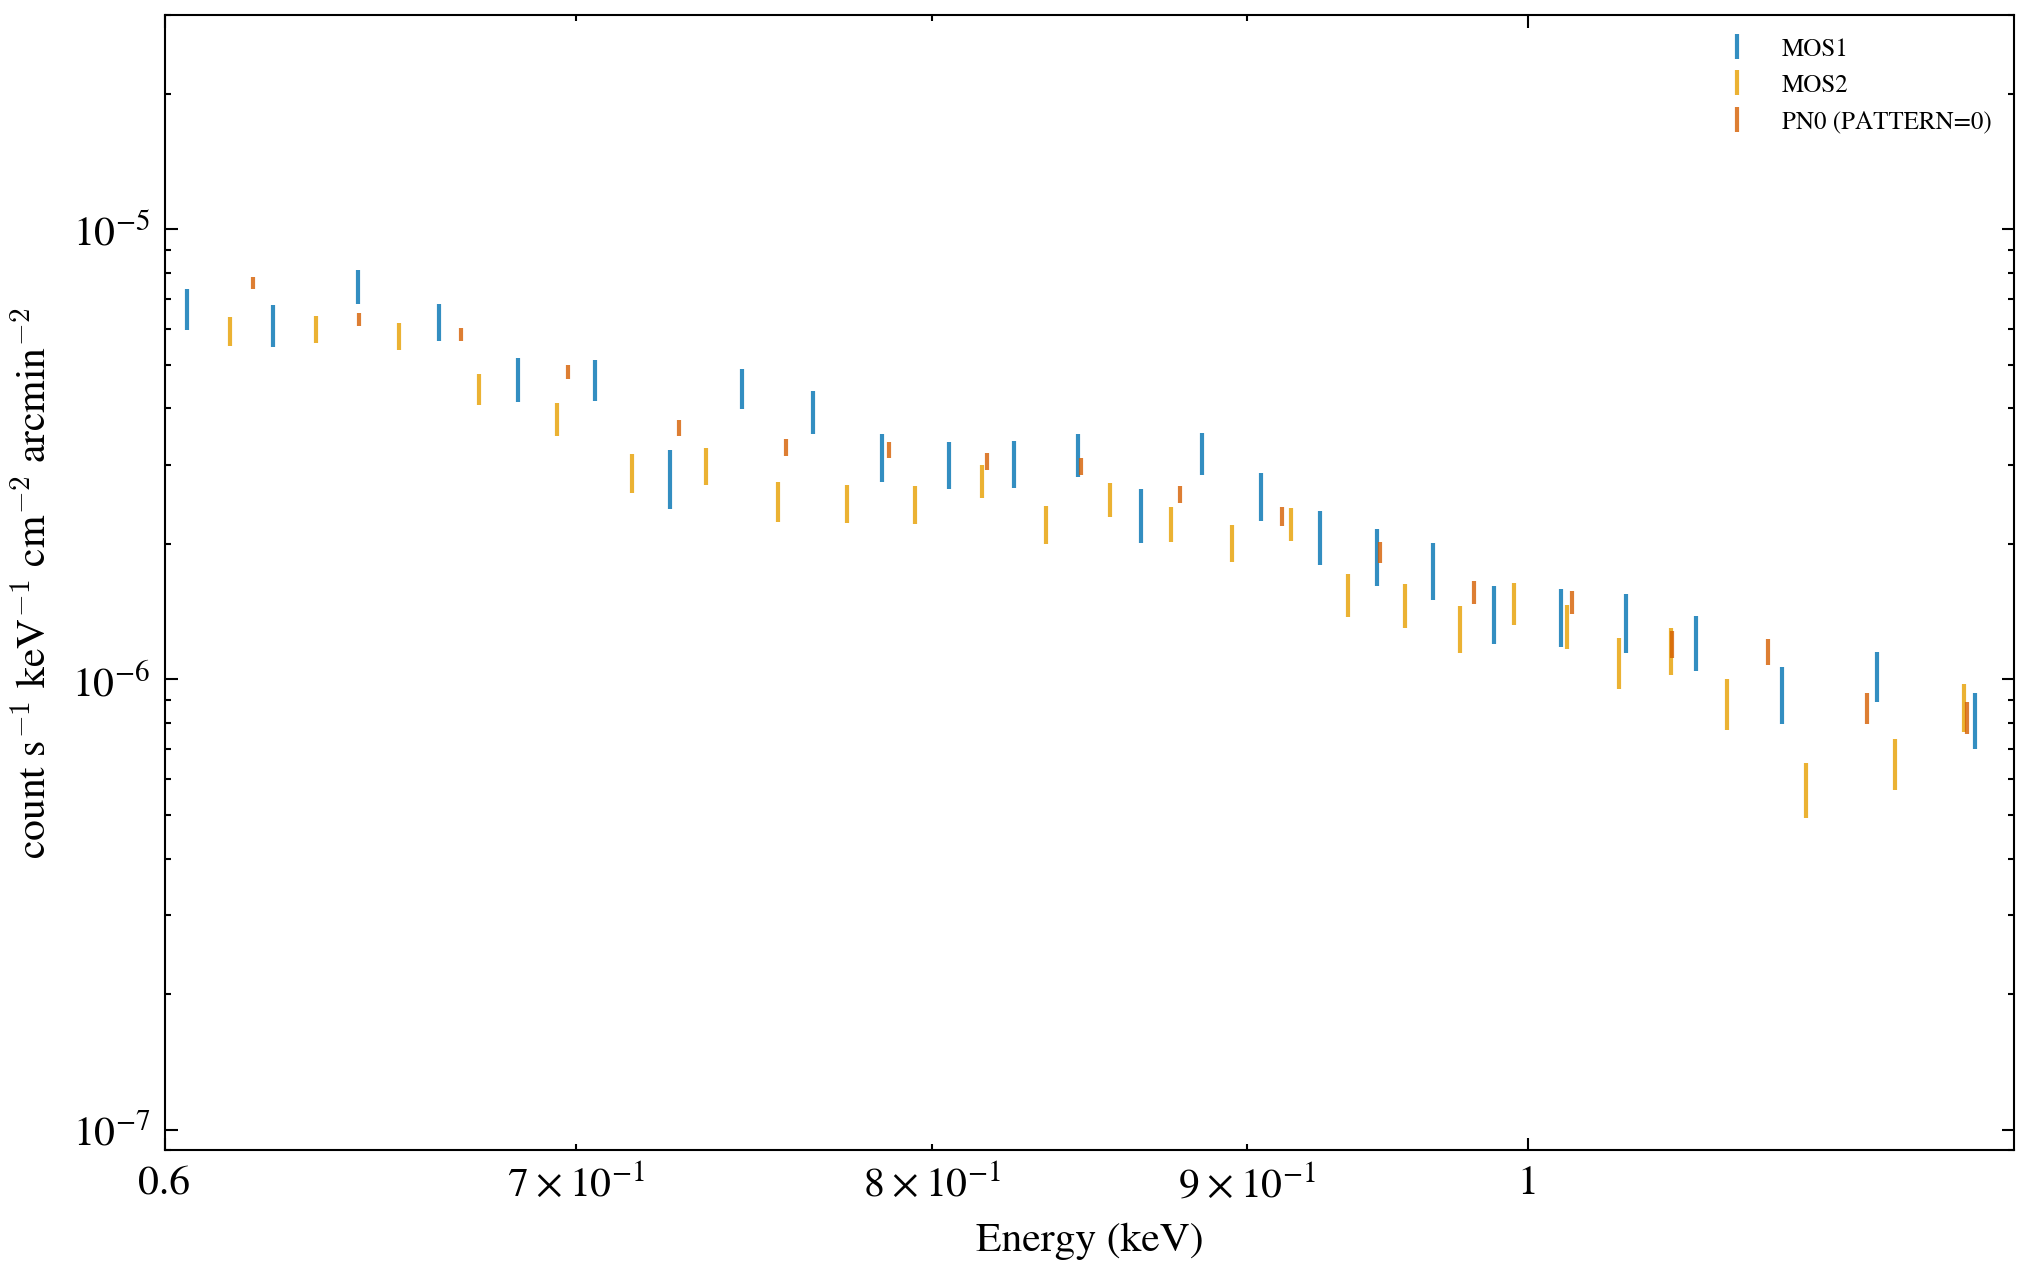
All inspections use xsherpa.inspect.SpectrumInspector; energy = 0.4–3.2 keV; group_subtracted_oversampling_SNR(sampling_rate=5, SNR=6); QPB subtraction; y-log; no model; no fit. The mandatory rate, sb, sb_flux, and 1col/2col PNG/PDF are all kept in the local science output.
Scientific limits
- QPB-subtracted is not pure M104. The spectra still contain sky foreground/background, CXB, residual soft protons, instrumental residuals, and possible pn OoT.
PATTERN==0is not an OoT correction。 pn0 is a single-pixel/high-resolution selection; the Extended Full Frame OoT must be handled separately by the matched OoT product.- The mask is not a common aperture. The chip gaps, bad pixels, and camera coverage of MOS1/MOS2/pn differ; PHA BACKSCAL records only the respective extraction area, not the ARF instrumental effective area.
- ARF-unfold is for quick-look only. Quantitative inference for extended sources must use forward-folded detector-specific models.
- 3B does not automatically become the production baseline because of this. It provides more MOS statistics, but the previous project had its GTI/QPB screening reasons for adopting 4B. A decision requires MOS-only and MOS+pn forward-folded validation fits under the same source/background/GTI/OoT contract.
Reproducibility and downloads
Independent audit status
Claude Sonnet medium reached its audit turn limit (
error_max_turns,15 turns reported against a14-turn cap) without a verdict; one internal tool attempt also emitted a Conda/plugin error. No Claude verdict was used.Network-enabled Codex
gpt-5.6-solmax independently reopened the FITS products, recomputed all key numbers without importing the project statistics functions, checked current ESA/SAS documentation, and returnedPASS WITH CAVEATSwith no Critical/High finding.Both Medium findings were corrected: BACKSCAL extraction area is now distinct from ARF instrumental effective area, and the MOS1 interpretation is limited to compound-contract sensitivity with count/QPB-statistical-only errors.
Explicit common
sb_fluxy-limits, exact 24/24 manifest cardinality, Git-head/SHA binding, removal of the four-byte public audit artifact, and10 focused tests were verified. Final current-tree re-review: PASS.
All published science assets are byte-bound to their local source artifacts by SHA256 in asset_manifest.json. The manifest also records the Git HEAD; because the working tree is uncommitted, the formal release identity is the per-asset SHA256 set rather than a clean commit.